
The Exit pages report provides details about the last page a visitor viewed on their visit.
It's a top-level report available in the Choose your report dropdown.
How to view the report
To open the Exit pages report:
- Go to Reporting > Owl Analytics.
- Select Exit pages from the Choose your report > Type dropdown.
- Select the time Period you want the report to display. Refer to Use the Period filter for more information on the options available.
- By default, reports include views and visits from authors and readers. Use the Audience to filter to Readers (no authors) or Authors only. Refer to Use the Audience filter for more information on the options available.
Anatomy of the report
The Exit pages report opens in the main report window:
 Sample Exit pages report
Here's a quick breakdown of the sections of this report:
1: Exits
This section displays the number of visits to this page that resulted in a visitor leaving your knowledge base.
2: Unique pageviews
Unique pageviews show the number of times a page has been viewed in different unique visits.
So if a visitor views the same page three times in the same visit, Owl Analytics tracks it as a single unique pageview but three separate pageviews.
Whenever unique pageviews is displayed, hovering over the report will also display a Unique pageviews percentage to the left of the Unique pageviews number. This percentage is the unique pageviews of each page as a percent of all the unique pageviews displayed in this report. If you hover over the percentage, the tooltip will also show you the percentage of total visits these unique pageviews represent.
3: Exit rate
An exit is tracked any time someone leaves your knowledge base after completing one or more actions. (If they don't complete any actions, it's tracked as a bounce.)
A page's exit rate is the percentage of people who left your knowledge base after visiting that specific page.
A high exit rate isn't necessarily a bad thing. If the page is a final step in a process or provides links to other resources you want to drive readers to, a high exit rate can mean your readers found what they needed.
Comparing exit rates for similar types of pages can help you develop a relative sense of whether a given exit rate is "good" or "bad".
4: Average page load time
For each visit, Owl Analytics tracks how long a page takes to load.
The average page load time (Avg. page load time) is calculated using those page load times and the total number of pageviews. This metric is displayed in seconds.
Longer average page load times can lead to more bounces or exits.
Aim for 3s or less
General website best practices suggest you keep page load times at or below three seconds.
To try to reduce average page load times for a given page, consider these factors:
- Overall page/content length: Longer pages can increase load times.
- Images, videos, and other resources: Larger images, longer videos, and other large files can increase load times.
- Third-party plugins or code: Additional code libraries, plugins, or other integrations can increase load times. These might be specific to a given page or may be loaded in Customize > Style (HTML & CSS) in the Custom <head> or Custom HTML templates.
- Visit sources: Page load times are directly impacted by internet bandwidth. If your primary audience has slower internet, you may need to further optimize or shorten your content to improve page load time metrics.
Access drilldown reports
The Exit pages report includes two drilldown reports for individual pages. Access these reports by hovering over the page you're interested in and selecting one of the in-line icons that appears:
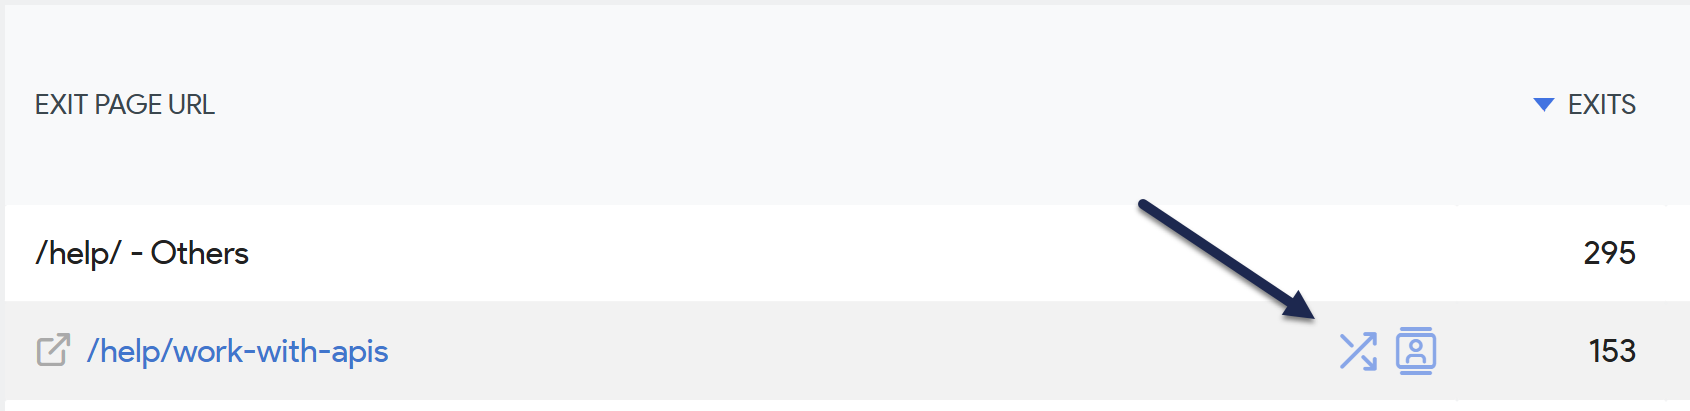 Select one of the in-line icons to open a drilldown report
Transitions report
Access the Transitions report by selecting the two diagonally-crossed arrows icon.
Use the Transitions report to figure out:
- How your visitors got to this page: Where someone comes from may have a huge impact on their exit rate. Review how visitors are getting here to determine if this page should have resulted in an exit or if it's a problem.
Segmented visit log
Access the Segmented visits log by selecting the person in the box icon.
I don't see this report
The Logs report is only available if don't Turn off visits log & visitor profiles in KB settings > Owl Analytics.
Use the Segmented visits log to figure out:
- Overall trends in visitors who visited this page: Review what else they did before viewing this page. This can help you figure out in more detail why someone might have exited here and whether that exit was a "good" or "bad" thing. For example, if someone started out on our knowledge base homepage, searched for SSO, ultimately found our Google SSO setup instructions, spent 8:49 on that page, and then exited, there's a really good chance they found what they were looking for and either set up Google SSO or figured out what they needed to do it at a later date. That would be a "good" exit for us. But if someone ended up on Google SSO setup instructions after viewing our analytics pages and then exited, this might be a "bad" exit because they were probably looking for Google Analytics documentation instead.