
The Entry pages report provides details about the page that began a knowledge base visit (the first page your visitor landed on).
It's a top-level report available in the Choose your report dropdown.
How to view the report
To open the Entry pages report:
- Go to Reporting > Owl Analytics.
- Select Entry pages from the Choose your report > Type dropdown.
- Select the time Period you want the report to display. Refer to Use the Period filter for more information on the options available.
- By default, reports include views and visits from authors and readers. Use the Audience to filter to Readers (no authors) or Authors only. Refer to Use the Audience filter for more information on the options available.
Anatomy of the report
The Entry pages report opens in the main report window:
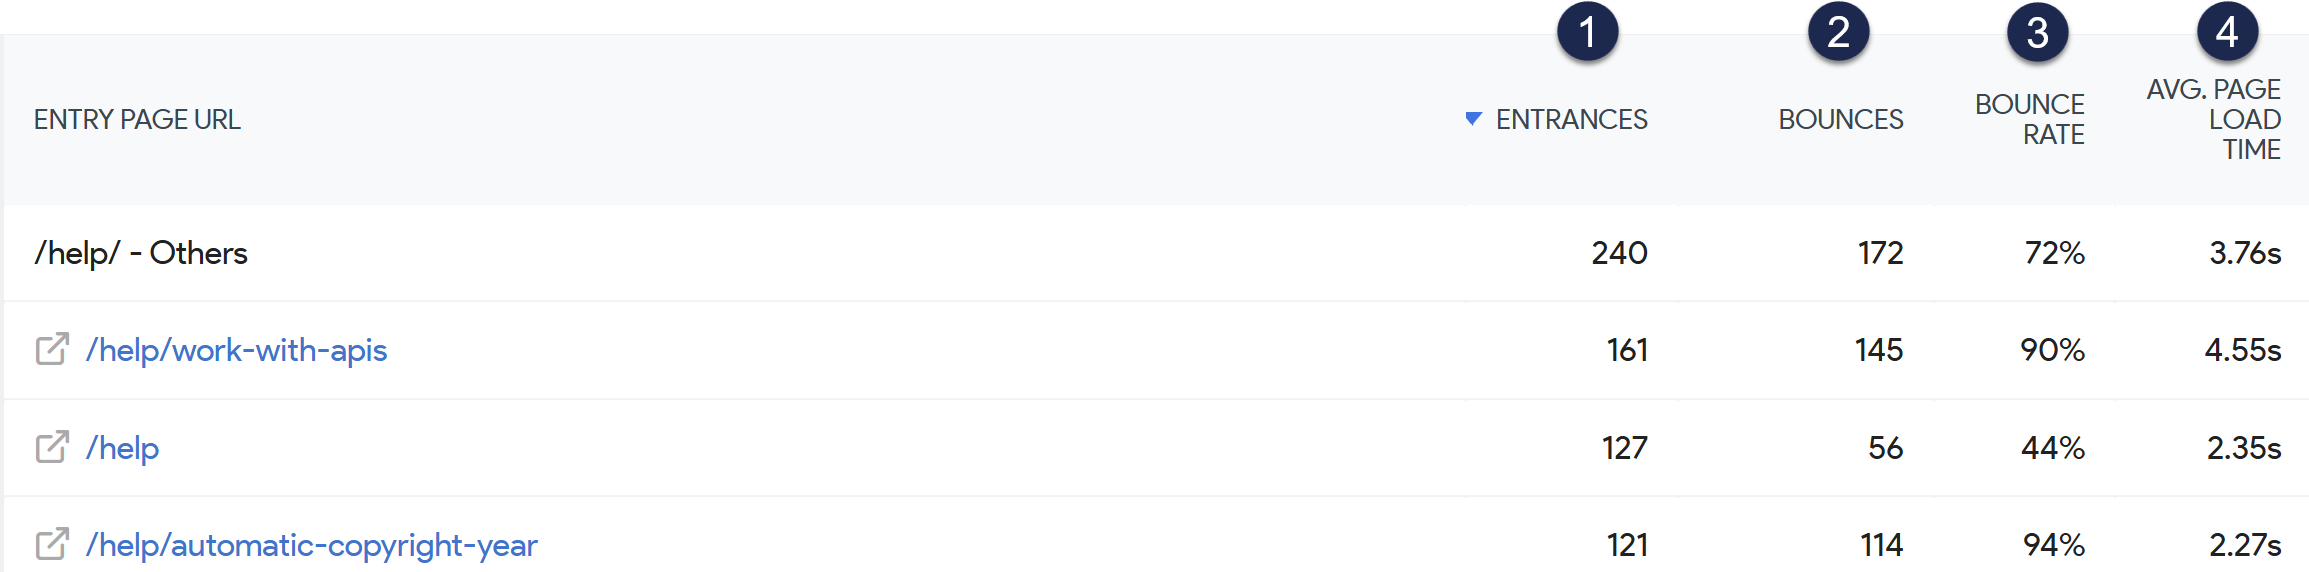 Sample Entry pages report
Here's a quick breakdown of the sections of this report:
1: Entrances
This column displays the number of visits that started on the page (basically, the number of times this page served as an entry page).
To view more detailed information about where visitors entered from, open the Transitions report.
2: Bounces
A bounce is when a visitor lands on a page of your knowledge base and leaves without completing any other action.
This metric shows the number of visitors who bounced from this entry page for the selected time period.
3: Bounce rate
A bounce is when a visitor lands on a page of your knowledge base and leaves without completing any other action.
The bounce rate for a page is the percentage of visitors to this page who bounced. It's calculated by dividing the number of bounces by the number of initial entrances to the page.
High bounce rates aren't necessarily a bad thing. It depends on what the purpose of the page is.
For example, if the knowledge base page answers a specific question or provides a set of steps, a high bounce rate may mean that you have "good" bounces: your page did its job and answered the question.
But if the page is a landing page, your homepage, a setup guide with links to additional steps, or a tutorial that should drive people deeper into your knowledge base content, a high bounce may mean you have "bad" bounces. You may be attracting the wrong people or the content or layout is irrelevant, poorly formatted, or otherwise unappealing.
If you're worried about a bounce rate, open the Transitions report for the page to explore how visitors are entering the page, or review the Segmented visits log to explore more details about the visitor or their actions. This can help you identify if the bounces are coming from particular sources (attracting the wrong people).
If neither of those reports helps you identify issues, you may need to review your content itself as well as its presentation and layout to try to improve your bounce rate.
4: Average page load time
For each visit, Owl Analytics tracks how long a page takes to load.
The average page load time (Avg. page load time) is calculated using those page load times and the total number of pageviews. This metric is displayed in seconds.
Longer average page load times can lead to more bounces or exits.
Aim for 3s or less
General website best practices suggest you keep page load times at or below three seconds.
To try to reduce average page load times for a given page, consider these factors:
- Overall page/content length: Longer pages can increase load times.
- Images, videos, and other resources: Larger images, longer videos, and other large files can increase load times.
- Third-party plugins or code: Additional code libraries, plugins, or other integrations can increase load times. These might be specific to a given page or may be loaded in Customize > Style (HTML & CSS) in the Custom <head> or Custom HTML templates.
- Visit sources: Page load times are directly impacted by internet bandwidth. If your primary audience has slower internet, you may need to further optimize or shorten your content to improve page load time metrics.
Access drilldown reports
The Entry pages report includes two drilldown reports for individual pages. Access these reports by hovering over the page you're interested in and selecting one of the in-line icons that appears:
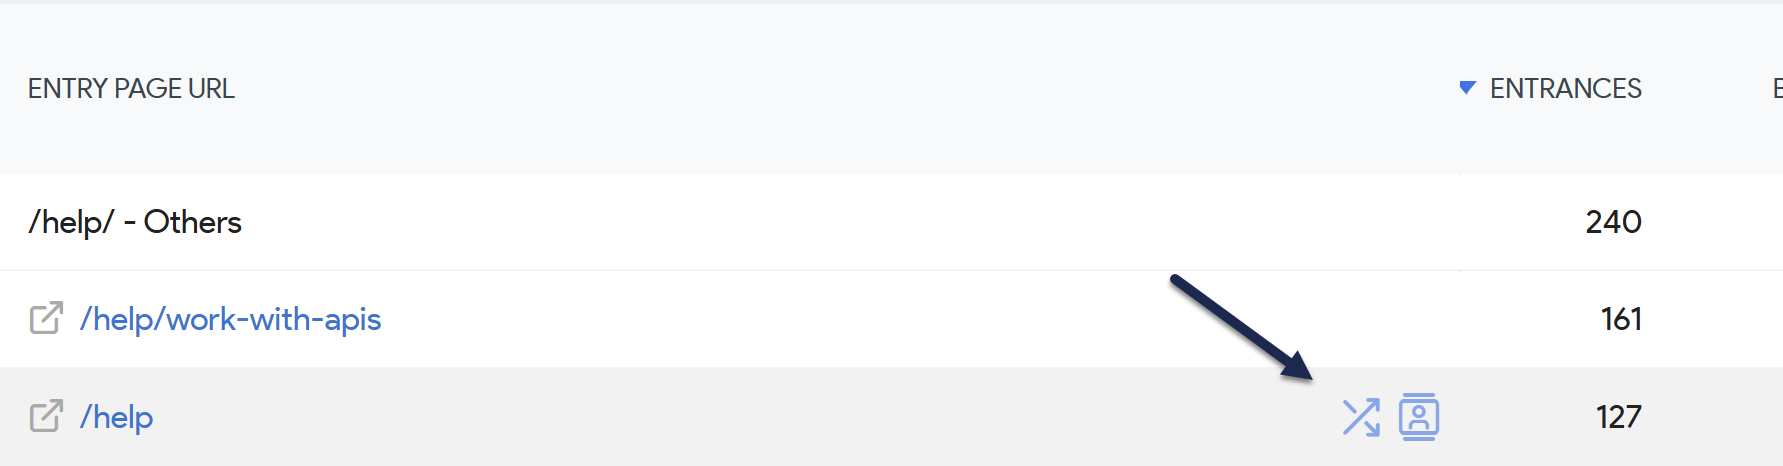 Select one of the in-line icons to open a drilldown report
Transitions report
Access the Transitions report by selecting the two diagonally-crossed arrows icon.
Use the Transitions report to figure out:
- How your visitors got to this entry page: Determine if different pages are attracting audiences from different places, which may help you make choices about changes you do or don't want to make to the page. Referrer source can have a huge impact on bounce rates.
- Where visitors went after this page: Are your visitors bouncing from here? Is that appropriate? High bounce rates aren't necessarily bad if the page is designed to answer a specific question or help visitors complete a given task--in these cases higher rates are better! But if this page is something like your knowledge base homepage or a key landing page to direct people elsewhere, a high bounce rate is a sign that the page isn't working how you expect, depending on where those visitors are coming from.
Segmented visit log
Access the Segmented visits log by selecting the person in the box icon.
I don't see this report
The Logs report is only available if don't Turn off visits log & visitor profiles in KB settings > Owl Analytics.
Use the Segmented visits log to figure out:
- Overall trends in visitors who visited this page: Review what else they did before and/or after viewing this page to identify trends and make decisions about your content.