
The Period dropdown in the Owl Analytics reports lets you filter the report by date. It includes these options:
Current: Today
The Today filter shows visits and views from today only.
Current: This week
The This week filter shows visits and views from the current calendar week only.
Current: This month
The This month filter shows visits and views from the current calendar month only. So if you use this filter in November, you'll see data from November 1 to the current date.
Current: This year
The This year filter shows visits and views from the current calendar year to-date only. So if you use this filter in June 2025, you'll see data for all of 2025 to-date.
Previous: Yesterday
The Yesterday filter shows visits and views from the previous day only. So if you use this filter on a Wednesday, you'll see data from Tuesday only.
Previous: Last week
The Last week filter shows visits and views from the seven days before yesterday. This is a rolling week, so if you use this filter on a Wednesday, you'll see data from the previous Tuesday to the end of the day Monday. (The immediate Tuesday would be covered by Yesterday.)
Previous: Last month
The Last month filter shows visits and views from the previous calendar month only. So if you use this filter in November, you'll see data from October.
Previous: Last year
The Last year filter shows visits and views from the previous calendar year only. So if you use this filter in 2026, you'll see data from 2025.
Custom range
Use the Custom range filter to select the start and end dates of the date range you'd like to view data for. This can be useful for looking at quarterly or other meaningful data not available in the pre-built options.
To use this option:
- Select Custom: Custom range from the Period dropdown.
- Select or tab into the Custom range textbox which appears.
- Use the calendar pickers there to select your start and end date.
The Audience dropdown in the Owl Analytics reports lets you filter the report by audience membership type. It includes these built-in options:
No selection/Choose audience
This is the default selection for reports. If you don't make any selection in the dropdown, it displays Choose audience and the reports will include all views and visits from all visitors, including readers and authors.
Authors only
The Authors only option filters your views and visits to only show those from logged-in authors.
Readers (no authors)
The Readers (no authors) option filters your views and visits to only show those from readers. All author visits and view data will be filtered out.
When in doubt, use this option
If you're worried about author views and visits skewing your analytics reports, this is the option you should pick!
Many Owl Analytics reports let you search the report for specific pages, readers, or other details. These searches act as report filters, showing only the report rows that contain your search word or phrase.
Reports that support search
The Owl Analytics reports that support search are:
- Readers report
- Pageviews report
- Searches report
- Entry pages report
- Exit pages report
- Page titles report
- Downloads report
Run a search to filter a report
To search one of these reports:
- Select the Search (magnifying glass) icon in the report's header:
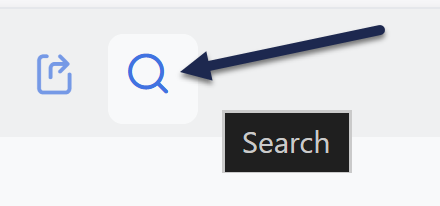 Select the Search icon
 - Enter your search word or phrase.
- Hit Enter to run the search and filter the report.
Authors with the default Editor or Writer role can export Owl Analytics reports. If you're using a custom role, you'll need to have the Reporting custom role permission to View analytics reports.
You can export any Owl Analytics report to work with your data offline or in tools like Excel, Google Sheets, or business intelligence dashboards.
There are two ways you can export data so you can import it into your tool of choice:
- Use the export option in any report to generate an export file containing the data you're currently viewing. Follow the instructions on this page to use this feature.
- Use the Owl Analytics Export API to programmatically export your Owl Analytics data in XML or CSV format to add it to another tool. This feature is available on select plans. Refer to Owl Analytics Export API for more information.
To export any Owl Analytics report at any plan level:
- Go to Reporting > Owl Analytics.
- Select the report you want to view and export from the Choose your report > Type dropdown.
- Select your desired time Period.
- Select your desired Audience.
- Select the document with an arrow icon to Export this dataset in other formats:
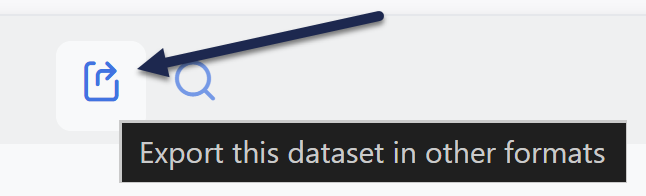 Export icon in Owl Analytics
 - An export modal opens for you to configure your export.
- Choose your Export format:
- CSV: Use this option for Google Sheets and most analysis or business intelligence tools.
- TSV (Excel): Use this option if you plan to use Excel to view the data.
- Json / XML: Use one of these options if you're providing the export to a developer or an analysis tool that prefers the format.
- HTML: Use this option if you'd like a simple web-page version of the data.
- Not sure which format you need? Check the tool you'll be using it in and refer to Which report format do I need? for additional guidance.
- Optional in some reports, recommended: If your export modal gives you the option to Flatten report, we recommend checking this box. This setting puts all data on one level for easier analysis. Flatten report is only available in the Entry pages report, Exit pages report, and Downloads report.
- If you don't check the box to Flatten report, you'll also have an option to Expand subtables. Check this box to make sure any nested subtables are expanded and included in your export.
- Optional: The export will automatically include full raw values, such as 3.151. Check the Format Metrics box to show numbers in an easier-to-read format, like 3.15s.
- Report type: If you chose Json or XML as your Export format, select whether you want the generated file to contain the Standard report, which starts immediately with the results, or the Report with metadata, which will provide a bunch of metadata about the report before listing the results. This includes date ranges, column definitions, and other context.
- Row limit: Choose whether to include All the rows available in the current report or set a Custom limit to get only the number of rows you enter. If you enter a row limit, the exporter pulls the top xx rows from the report.
- Once you've finished setting up your export, select Export to generate the export.
Your file will download or open immediately, depending on the format you chose. (CSV and TSV will download; Json, XML, and HTML will open).
To export data from Owl Analytics programmatically, refer to the Owl Analytics Export API documentation.
This approach is especially useful if you want to feed Owl Analytics data into data visualization or analysis tools on a set schedule. This feature is available on select plans.