
The Row evolution graph provides a line chart history of selected metrics for a selected location, so you can see how metrics trend for this location over time.
It's a drilldown report available from the Locations report.
How to view the graph
To open the Row evolution graph:
- Go to Reporting > Owl Analytics.
- Select the Locations report from the Choose your report > Type dropdown.
- Select the time Period you want the report to display.
- Drill into the country containing the location you want to view the graph for. Once you select an individual region or city, the Row evolution graph opens automatically.
Anatomy of the graph
The Row evolution graph opens in a modal over the Locations report. It includes several sections:
 Sample Row evolutions graph
Let's review each section in more detail below.
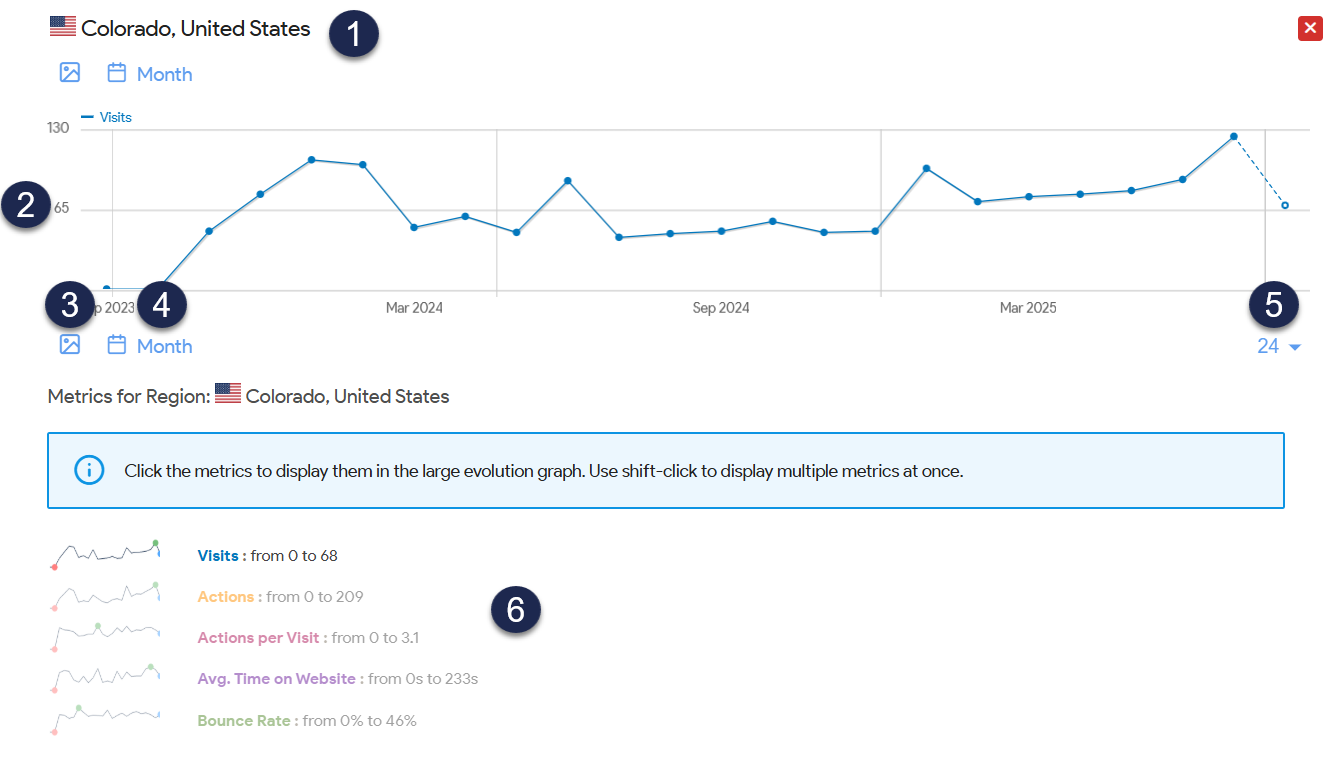
1: Location title
The top of the graph displays the selected location's title.
2: Graph
The graph displays line charts for the selected metric(s) and time period. Hover over any point on the graph to display a pop-up with the exact numbers for the metric on that date.
3: Export as image
Select the Export as Image icon (the picture icon) to open a modal with just the image in it.
Right-click on the image and select Save image As... to save the image to your computer as a .png with the filename of your choice.
This can be a great way to share these metrics with a larger audience, in a presentation, as part of key performance indicators, and so on!
4: Change period selector
Use the Change period icon and label (a calendar with the current x-axis period label) to change the time period used for the x-axis. Choose from Day, Week, Month, and Year.
5: Rows to display
Use the Rows to display numeric dropdown to change the number of the selected periods to display. Choose from 3, 6, 12, 24, 36, and 120.
6: Metrics for region
The Row evolution graph can display a few different metrics. Select a metric to update the graph to display only that metric. Or hold down the Shift key and select multiple metrics to display them concurrently in the same graph.
Choose from:
- Visits
- Actions
- Actions per Visit
- Avg. Time on Website
- Bounce Rate