
The Page titles report provides pageview, bounce rate, exit rate, time on page, and load time statistics for individual pages in your knowledge base, listed by page title.
It's a top-level report available in the Choose your report dropdown.
Prefer page URLs?
The Pageviews report provides this same information listed by page URL instead of title.
How to view the report
To open the Page titles report:
- Go to Reporting > Owl Analytics.
- Select Page titles from the Choose your report > Type dropdown.
- Select the time Period you want the report to display. Refer to Use the Period filter for more information on the options available.
- By default, reports include views and visits from authors and readers. Use the Audience to filter to Readers (no authors) or Authors only. Refer to Use the Audience filter for more information on the options available.
Anatomy of the report
The Page titles report opens in the main report window. It displays seven columns:
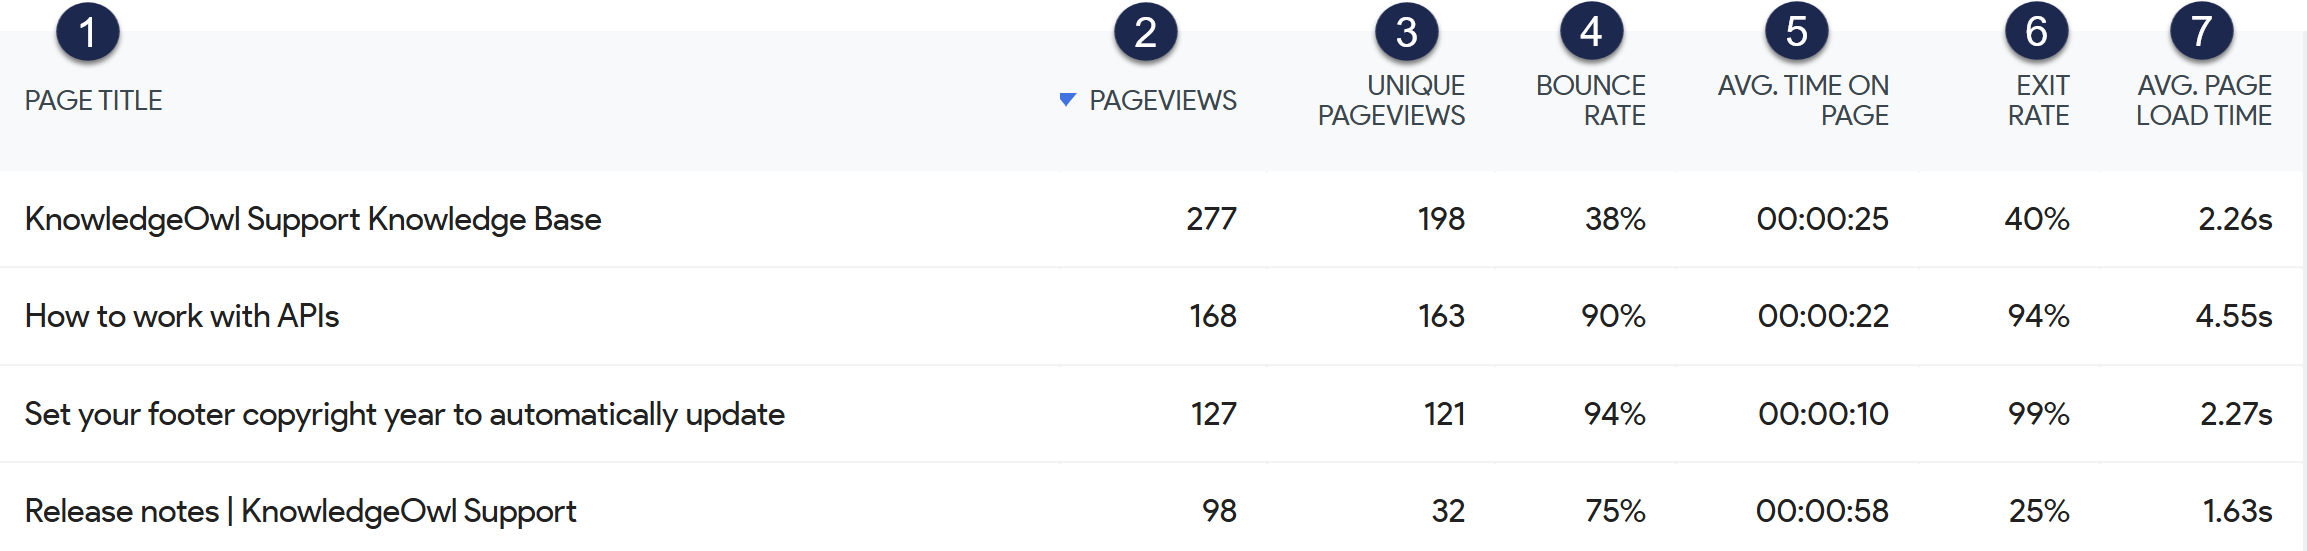 Sample Page titles report
Let's review each column in more detail below.
1: Page title
The title of the article, category, or page in your knowledge base.
1: Pageviews
Pageviews are the number of times a page has been viewed. Every single view Owl Analytics can track is tracked in this number, including repeat views in the same visit and repeat views by a returning visitor.
When pageviews are displayed in most reports, hovering over the report will also display a Pageview percentage to the left of the pageviews number. This percentage is the views of each page as a percent of all the pageviews displayed in the report.
2: Unique pageviews
Unique pageviews show the number of times a page has been viewed in different unique visits.
So if a visitor views the same page three times in the same visit, Owl Analytics tracks it as a single unique pageview but three separate pageviews.
Whenever unique pageviews is displayed, hovering over the report will also display a Unique pageviews percentage to the left of the Unique pageviews number. This percentage is the unique pageviews of each page as a percent of all the unique pageviews displayed in this report. If you hover over the percentage, the tooltip will also show you the percentage of total visits these unique pageviews represent.
3: Bounce rate
A bounce is when a visitor lands on a page of your knowledge base and leaves without completing any other action.
The bounce rate for a page is the percentage of visitors to this page who bounced. It's calculated by dividing the number of bounces by the number of initial entrances to the page.
High bounce rates aren't necessarily a bad thing. It depends on what the purpose of the page is.
For example, if the knowledge base page answers a specific question or provides a set of steps, a high bounce rate may mean that you have "good" bounces: your page did its job and answered the question.
But if the page is a landing page, your homepage, a setup guide with links to additional steps, or a tutorial that should drive people deeper into your knowledge base content, a high bounce may mean you have "bad" bounces. You may be attracting the wrong people or the content or layout is irrelevant, poorly formatted, or otherwise unappealing.
If you're worried about a bounce rate, open the Transitions report for the page to explore how visitors are entering the page, or review the Segmented visits log to explore more details about the visitor or their actions. This can help you identify if the bounces are coming from particular sources (attracting the wrong people).
If neither of those reports helps you identify issues, you may need to review your content itself as well as its presentation and layout to try to improve your bounce rate.
4: Average time on page
Owl Analytics tracks the time spent on a given page during each visit until the visitor completes an action to navigate to another page. The final page in a visit (the page where a visitor exits or bounces) is logged as 0 seconds.
The average time on page (Avg. time on page) is calculated by taking the sum total of logged time on this page and dividing it by the total number of visits. This metric is displayed in hours:minutes:seconds format.
Low or high average time on page is not automatically a good or bad sign. It depends on the length of the page, its purpose, and what visitors are doing afterward. To determine if the average time on page rate is good or bad:
- Open the Transitions report for the page to explore how visitors are entering and leaving the page. If they're leaving quickly but going to the resources you want them to go to, a low average time on page is a good sign! Conversely, a high average time on page for a complex guide such as single sign-on setup may be a good sign, as it means that readers are sticking with the documentation while they set things up.
- You may also want to review the Segmented visits log to explore more details about the visitor or their actions. This can help you identify if they're spending more time on more complex resources, if they're just quickly browsing around and maybe this average time made sense, and so on.
- Compare the average time on page for pages of similar length and type to develop a relative scale of what a "good" or "bad" average time on page is. This can help you set some general baselines for your content so you only spend time reviewing averages outside of those.
5: Exit rate
An exit is tracked any time someone leaves your knowledge base after completing one or more actions. (If they don't complete any actions, it's tracked as a bounce.)
A page's exit rate is the percentage of people who left your knowledge base after visiting that specific page.
A high exit rate isn't necessarily a bad thing. If the page is a final step in a process or provides links to other resources you want to drive readers to, a high exit rate can mean your readers found what they needed.
Comparing exit rates for similar types of pages can help you develop a relative sense of whether a given exit rate is "good" or "bad".
6: Average page load time
For each visit, Owl Analytics tracks how long a page takes to load.
The average page load time (Avg. page load time) is calculated using those page load times and the total number of pageviews. This metric is displayed in seconds.
Longer average page load times can lead to more bounces or exits.
Aim for 3s or less
General website best practices suggest you keep page load times at or below three seconds.
To try to reduce average page load times for a given page, consider these factors:
- Overall page/content length: Longer pages can increase load times.
- Images, videos, and other resources: Larger images, longer videos, and other large files can increase load times.
- Third-party plugins or code: Additional code libraries, plugins, or other integrations can increase load times. These might be specific to a given page or may be loaded in Customize > Style (HTML & CSS) in the Custom <head> or Custom HTML templates.
- Visit sources: Page load times are directly impacted by internet bandwidth. If your primary audience has slower internet, you may need to further optimize or shorten your content to improve page load time metrics.
Access drilldown reports
The Page titles report includes two drilldown reports for individual pages. Access these reports by hovering over the page you're interested in and selecting one of the in-line icons that appears:
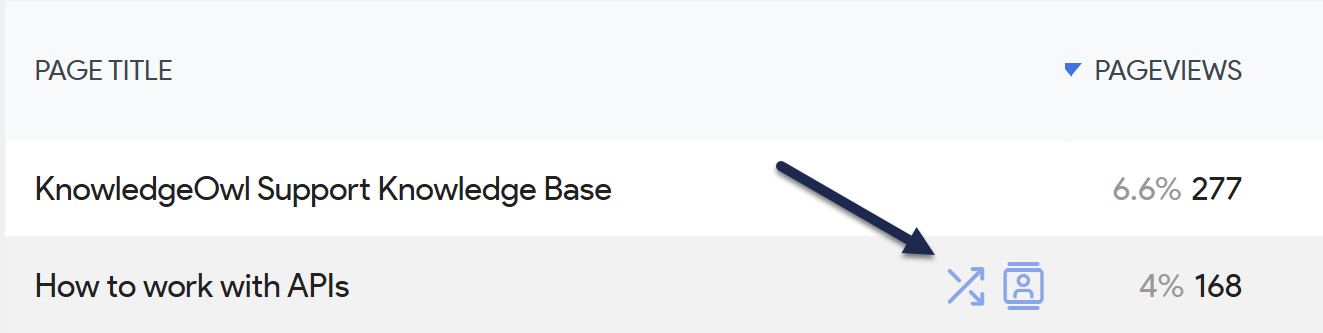 Select one of the in-line icons to open a drilldown report
Transitions report
Access the Transitions report by selecting the two diagonally-crossed arrows icon.
Use the Transitions report to figure out:
- How your visitors got to this page: Determine if different pages are attracting audiences from different places, which may help you make choices about changes you do or don't want to make to the page.
- Where visitors went after this page: Are your visitors exiting or bouncing from here? Is that appropriate? High bounce rates or exit rates aren't necessarily bad if the page is designed to answer a specific question or help visitors complete a given task--in these cases higher rates are better. Did they navigate somewhere that made sense? Did they search for a related term because you didn't have a link to that resource on this page?
Segmented visits log
Access the Segmented visits log by selecting the person in the box icon.
I don't see this report
The Logs report is only available if don't Turn off visits log & visitor profiles in KB settings > Owl Analytics.
Use the Segmented visits log to figure out:
- What else your visitor did: Review what else they did before and/or after viewing this page to identify trends in navigation or usage that may help you optimize your content.